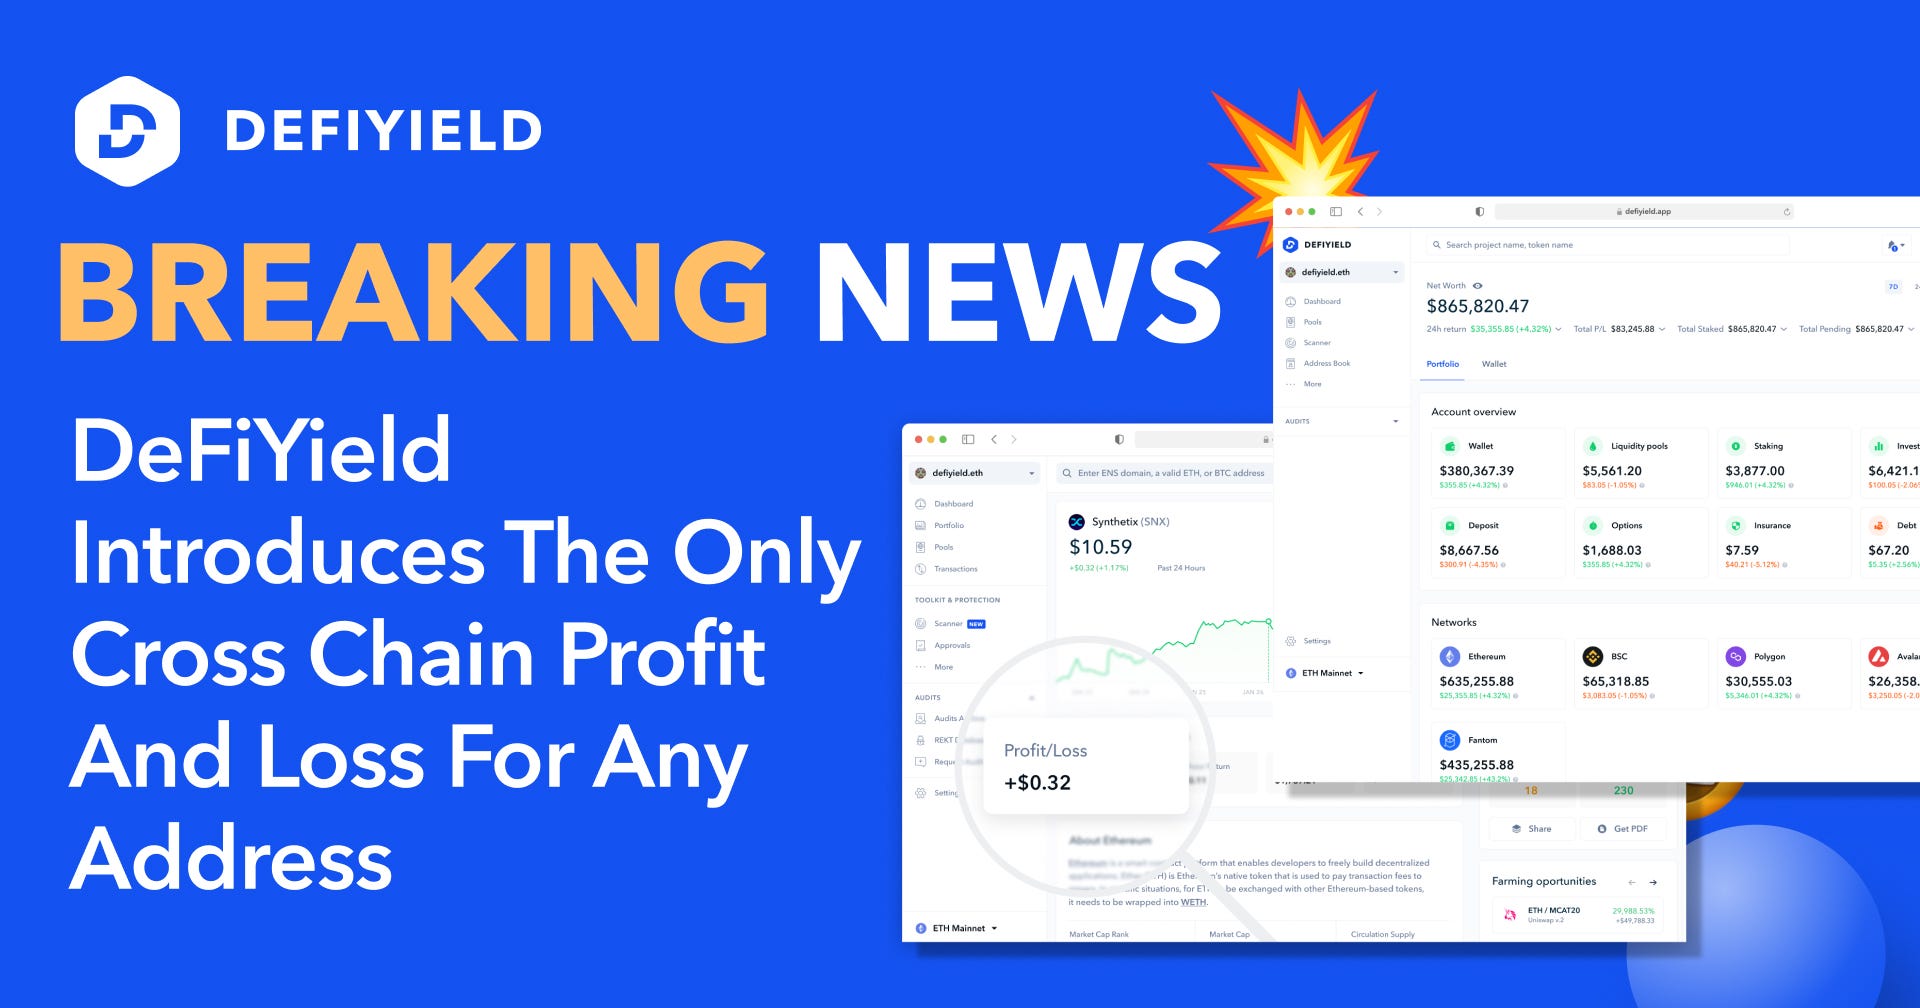
Stop tracking and calculating your Profit and Loss manually! Connect your wallet or view any wallet you want and instantly check the asset’s Profit and Loss Cross-Chain.
What’s the gain and what’s the loss? We can tell you!
There’s a lot of data to track to be a successful investor and make informed decisions. This includes but is not limited to the Impermanent Loss risk, Return on Investments, claimable rewards, new pools and vaults, portfolio performance…
One of the most interesting types of information that is important for any investor is Profit and Loss.
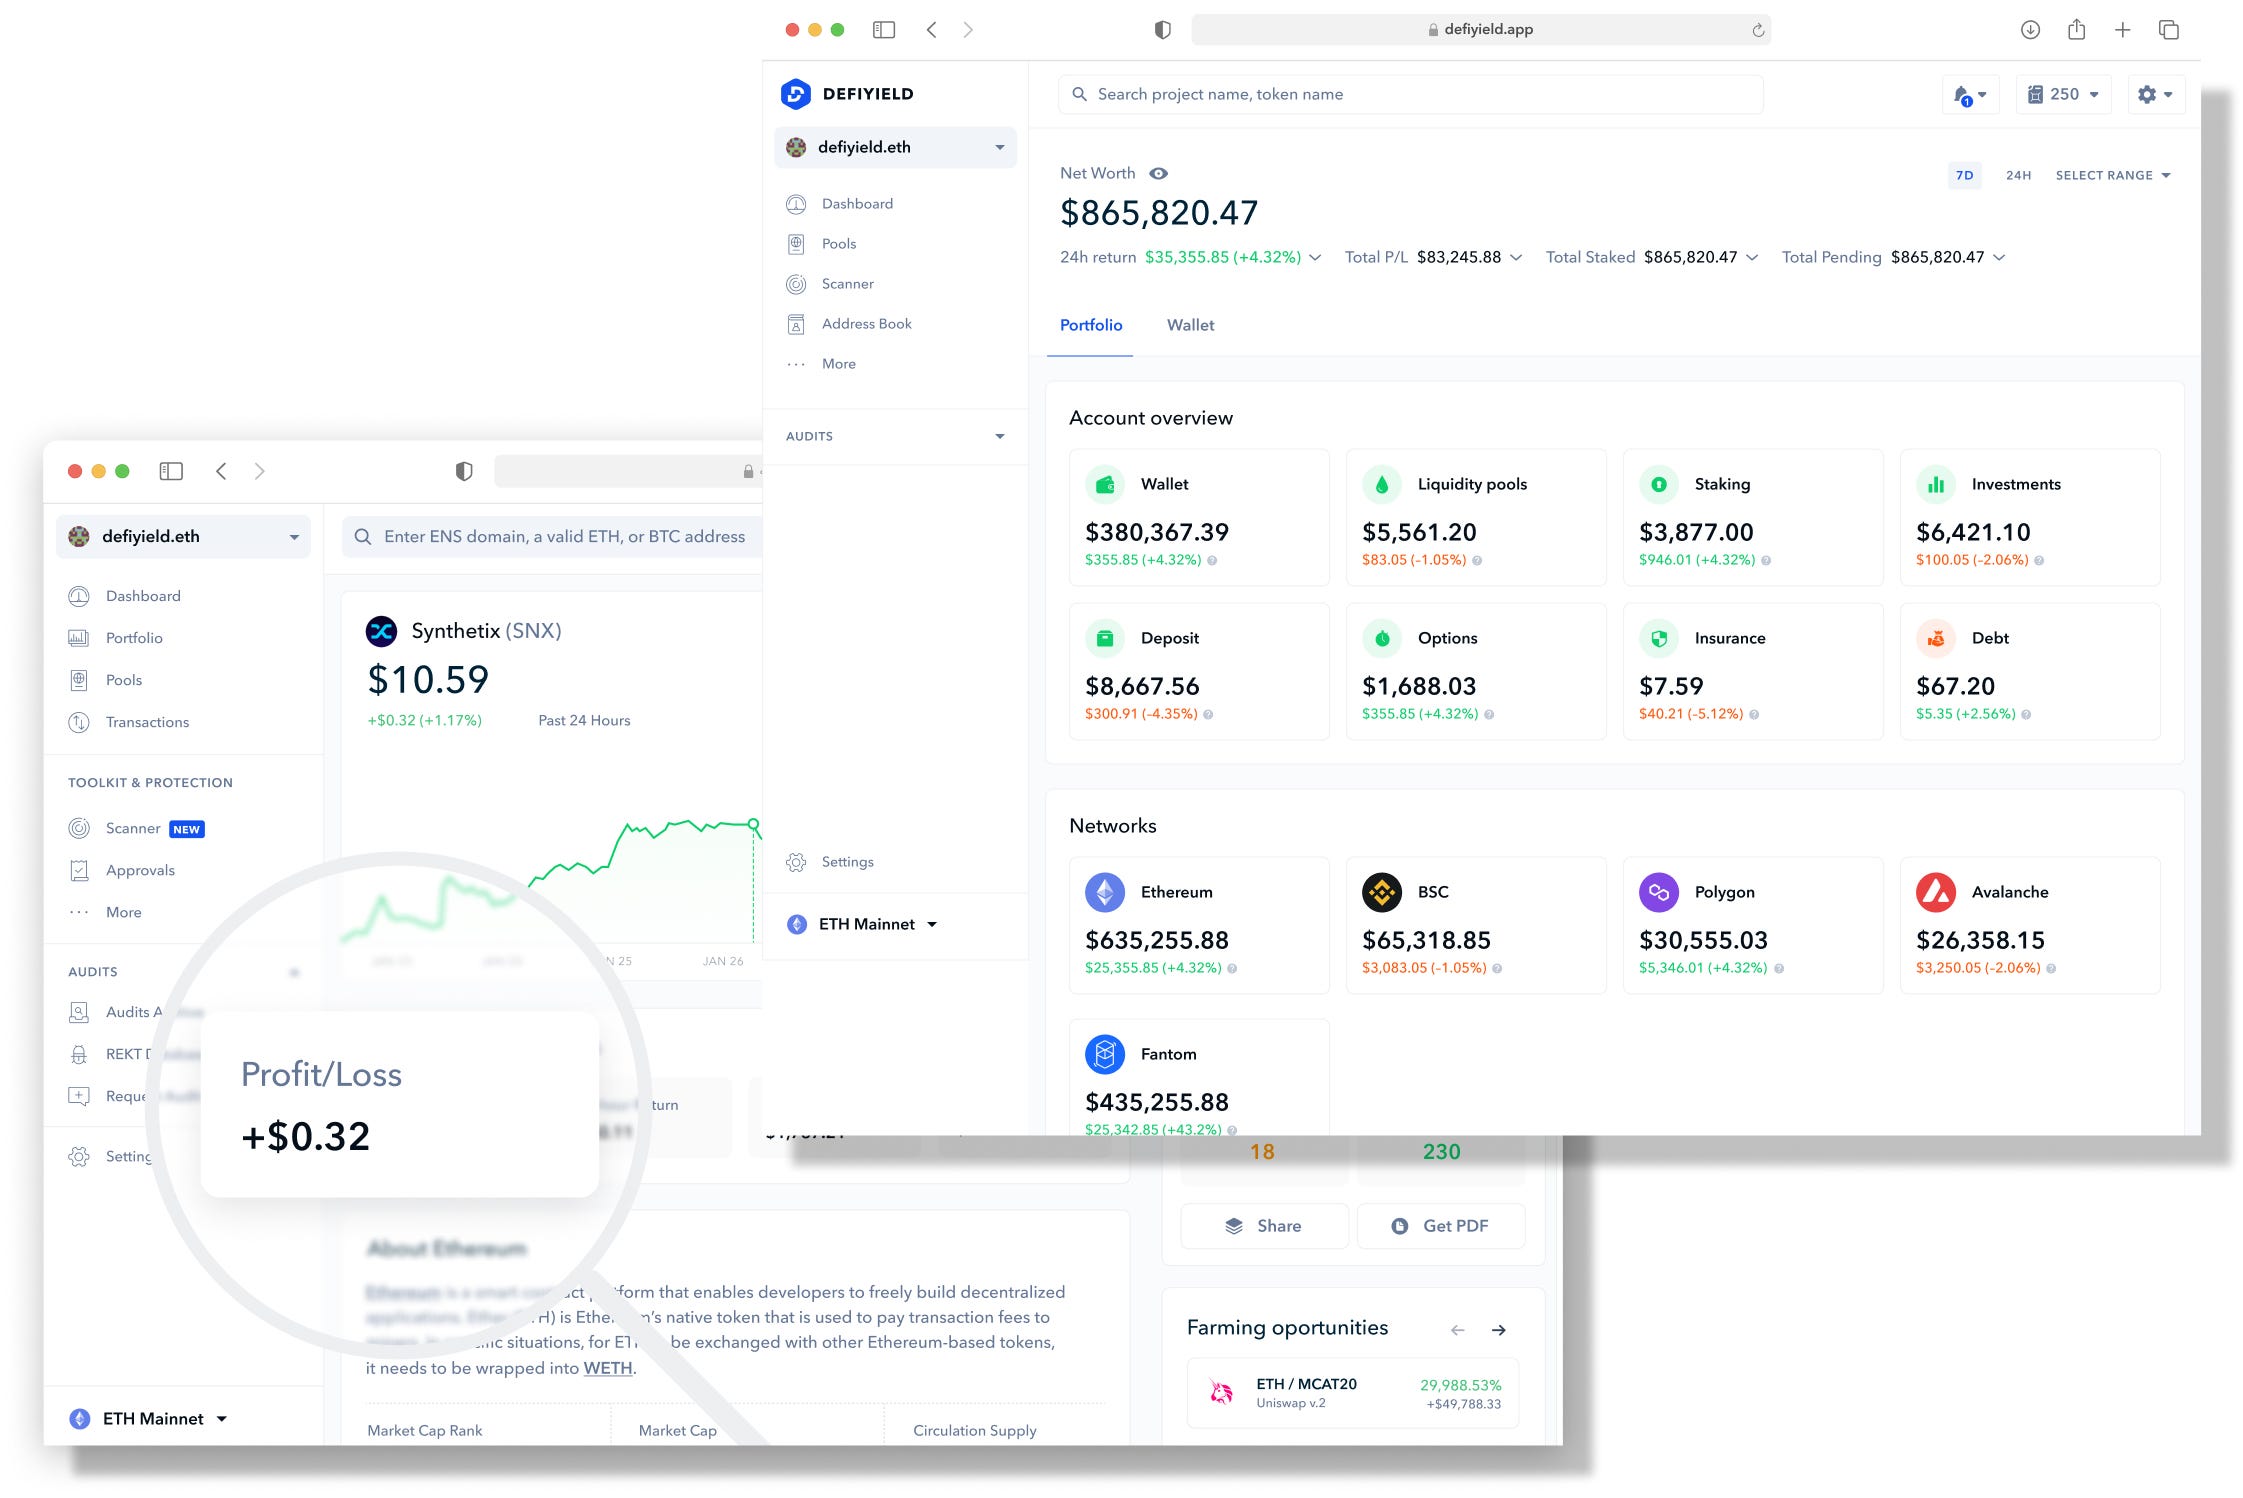
Watch a quick walkthrough!
What is the De.Fi Dashboard?
The De.Fi dashboard has the perfect combination of asset management and risk management tools to help you succeed and stay safe in DeFi. It enables you to:
- Track investment opportunities,
- Monitor performance metrics including Profit & Loss, Impermanent Loss and Farming Rewards.
- Allocate and reallocate funds across different projects and blockchains.
- Stay protected with the Approvals Analyzer, which informs you of approvals for malicious Dapps that contain backdoors, infinite minting and other security issues.
The dashboard is designed to be cross-chain, compatible with Ethereum, Binance Smart Chain, Polygon, Arbitrum, Avalanche, Solana, Polkadot and all non-EVM-compatible chains.
By connecting a DeFi wallet and navigating to the Dashboard section, a user will be able to see:
- Account overview featuring the total balance of the wallet and the total value of funds deposited in vaults — including those in liquidity pools, those being lent out, staked funds and the total debt value.
- Value of assets grouped by blockchain network.
- DeFi platforms currently in use.
How is the Profit and Loss Calculated?
The Portfolio section of the dashboard enables users to see wallet information by tokens, including prices, balances and USD values, as well as to filter portfolio data by blockchain network. Users can also quickly exchange tokens for the best rates on the market.
Significantly, users can see a P&L for each asset in their portfolios.
It accounts for asset’s balance change from any incoming and outgoing transfers, received rewards (RR) and accrued rewards by the end of the analyzed period (ARE). The received rewards value is calculated multiplying the total amount of the reward asset with its weighted price, and the value of accruals is expressed based on the current price of the asset.
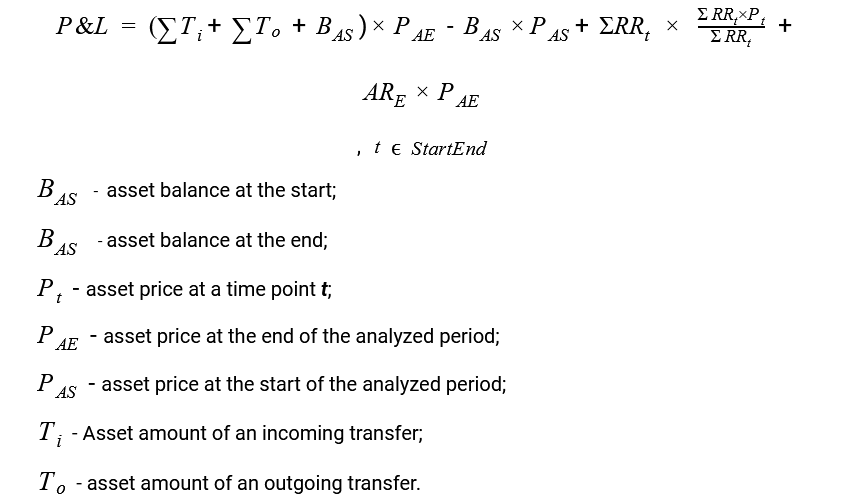
Based on this complicated formula, a user can easily track 24h Profit and Loss and historical Profit and Loss.
Why do I need to Know the Profit and Loss?
Profit and Loss data can help to understand the potential of the investment and take a further analysis along with the decision on how to manage and relocate the investment. You can check your profit and loss by a specific asset in the wallet, type of investment (Liquidity Pools, Insurance, Staking, Deposits, etc.) and network (Ethereum, Binance, Polygon, Fantom).
Other De.Fi solutions
With the De.Fi dashboard users can not only track Profit and Loss but also add and remove liquidity along with viewing liquidity positions and new investing opportunities, scan and decline allowances and access unique databases such as The World’s First Audit and REKT Databases. The exclusive Automatic Smart Contract Audit Scanner provides the 1-click free audit report by any smart contract scanning for 150+ vulnerabilities and 10+ criteria.
Try the full suite of innovative De.Fi tools right now — https://de.fi/dashboard
Check our guides:
Tezos Ultimate Yield Farming Guide [Infographics]
Solana Network Ultimate Yield Farming Guide [Infographics]
Fantom Network Ultimate Yield Farming Guide [Infographics]
Huobi ECO Chain Ultimate Guide for Yield Farming
Polygon Network Ultimate Guide for Yield Farming
Binance Chain Ultimate Guide for Yield Farming
EOS Ultimate Yield Farming Guide
Arbitrum Ultimate Guide [Infographics]
The Ultimate Yield Farming Guide For Terra Blockchain (Luna) [Infographics]
